Industrial Automation Cost Breakdown in 2026




For finance approvers planning 2026 upgrades, a clear industrial automation solutions cost analysis is essential to balance capital spending, operating efficiency, and long-term risk. From pumps, control valves, and compressors to filtration and smart monitoring, understanding where costs rise—and where savings compound—helps turn automation from a budget concern into a measurable investment decision.
In fluid-intensive industries, automation costs rarely sit in one line item. They are distributed across equipment selection, controls architecture, energy demand, installation complexity, compliance, maintenance, and downtime exposure. For budget owners reviewing pump sets, pneumatic control valves, air compressor systems, and separation equipment, the financial question is not simply “How much does it cost?” but “What is the cost structure over 3 to 10 years?”
That is where a disciplined industrial automation solutions cost analysis becomes useful. It helps finance teams compare upfront spending with measurable gains such as 8%–25% lower energy consumption, 15%–40% fewer manual interventions, and shorter recovery periods for production disturbances. In 2026, these trade-offs matter even more as energy efficiency regulations, digital retrofit demands, and material lead-time volatility continue to shape capital approval decisions.
What Drives Industrial Automation Costs in 2026
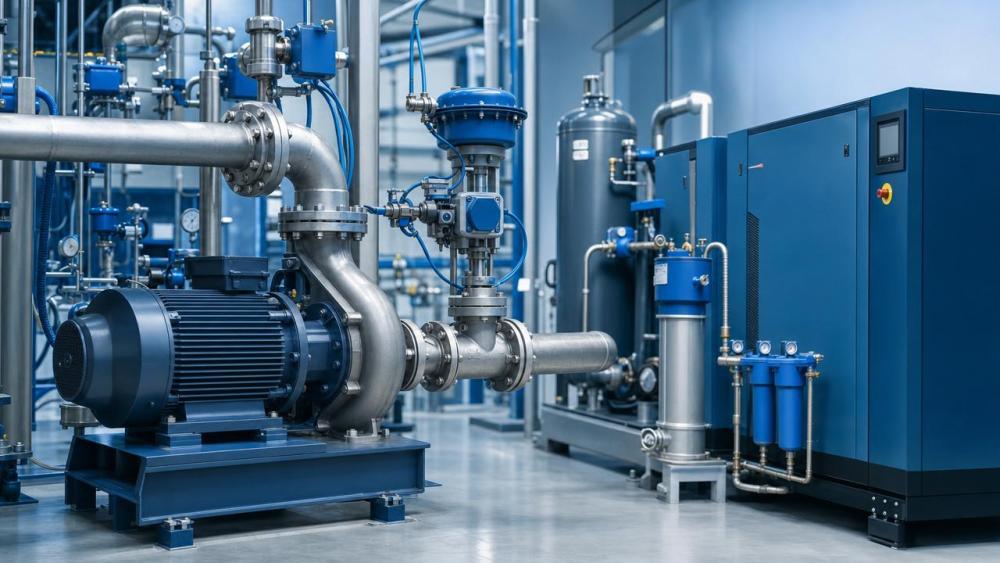
A practical industrial automation solutions cost analysis starts by separating costs into five layers: core equipment, controls and instrumentation, engineering and commissioning, operating expense, and lifecycle risk. For fluid control systems, these layers interact more tightly than in simple discrete automation because hydraulic load, pressure stability, air demand, and filtration quality all affect production continuity.
For example, a centrifugal pump upgrade may appear affordable at purchase stage, but the total budget can rise by 20%–35% once variable frequency drives, seal monitoring, skid modifications, and integration with SCADA or DCS are added. Likewise, a smart pneumatic control valve may represent a moderate equipment cost, yet calibration, actuator sizing, digital positioner tuning, and corrosion-resistant trim materials can materially change the final project value.
1. Core Equipment Cost
Core machinery usually accounts for 35%–55% of the initial capital budget. In fluid systems, this includes industrial centrifugal pumps, high-pressure plunger pumps, compressor packages, control valves, filtration skids, and separators. Cost variation depends on flow rate, pressure class, metallurgy, motor efficiency grade, sealing method, and redundancy design.
A finance team should pay close attention to specifications that directly influence long-term cost. Common examples include motor sizes from 15kW to 250kW, pressure ratings above 40 bar, duplex stainless or special alloy wet parts, and clean-in-place compatibility. These features may increase purchase price by 10%–30%, but they can reduce emergency failure risk in corrosive or high-cycle service.
2. Controls, Sensors, and Digital Integration
Controls architecture often represents 12%–22% of total project cost. This includes PLCs, I/O modules, HMIs, smart positioners, pressure transmitters, flow meters, temperature sensors, edge gateways, and software licenses. For compressor systems and automated valve networks, digital monitoring can add a modest 5%–10% to capex while creating far more visibility into load profile, leakage, and unstable process conditions.
In 2026, many projects also require cybersecurity segmentation, historian connectivity, and remote diagnostics capability. These are no longer optional extras in many plants. Even a compact upgrade may require 2–4 weeks of controls engineering and factory acceptance planning before site work begins.
3. Installation, Commissioning, and Production Interruption
Site installation is frequently underestimated during approval. Piping rerouting, cable tray expansion, compressed air header balancing, instrument air quality improvement, and commissioning support can add another 15%–28% to project cost. If shutdown windows are limited to 48–72 hours, labor rates and pre-assembly requirements often rise further.
In process facilities, the largest hidden cost is usually production interruption. A delayed switchover on a pump train, separator line, or critical control valve station may create losses far larger than equipment price differences. That is why finance approvers should request scenario-based downtime assumptions, not just procurement quotations.
The table below shows a practical way to break cost categories for typical fluid automation projects. It helps budget reviewers see where “low-price” proposals can later become expensive.
The key conclusion is that the purchase order value alone does not define the true cost. In most fluid automation environments, the most controllable savings come from energy optimization, maintainability, and engineering decisions made before installation begins.
Cost Breakdown by Fluid Automation System Type
Different machinery categories have different cost logic. A strong industrial automation solutions cost analysis should therefore review each system separately rather than applying a single ROI rule across the plant. Pumps, compressors, control valves, and filtration systems create value in different ways and fail in different ways.
Industrial Centrifugal Pumps
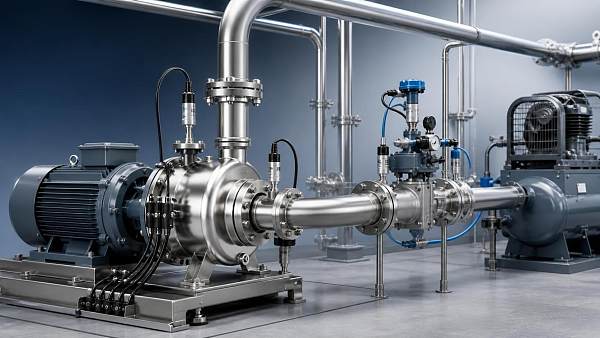
Pump automation budgets are heavily influenced by flow variability, cavitation control, seal management, and motor efficiency. When variable demand is present, pairing pumps with VFDs and pressure feedback can reduce wasted throttling energy by 10%–25%. However, the business case weakens if suction conditions are unstable or if impeller trimming is ignored during design review.
Where finance teams should look
- Motor efficiency class and expected annual running hours, often 4,000–8,000 hours
- Seal plan requirements for hazardous or leakage-sensitive media
- Redundancy level such as N+1 for critical chemical or water systems
- Predictive monitoring for vibration, bearing temperature, and suction pressure
Smart Pneumatic Control Valves
For control valves, cost is driven less by body casting alone and more by trim design, actuator sizing, fail-safe action, positioner intelligence, and service severity. In corrosive or flashing service, a cheaper trim selection can shorten service intervals from 24 months to less than 9 months. That turns a low capex choice into a high maintenance decision.
Finance approvers should also consider instrument air quality. If compressed air dew point and filtration are not controlled, actuator reliability falls and diagnostic performance becomes less trustworthy. This is a small utility cost issue that can have outsized operational consequences.
Air Compressor Systems
Compressed air is one of the most expensive utilities in many factories. In a typical industrial automation solutions cost analysis, energy can represent 65%–80% of a compressor’s lifecycle cost over 5 to 7 years. That makes specific power, load/unload behavior, leakage rate, and pressure setpoint strategy more financially relevant than headline equipment price.
Permanent magnet variable frequency systems and two-stage compression often require higher initial investment, but can improve part-load efficiency in plants with variable demand. If a site runs 6,000 hours per year and has 15% air leakage, leak reduction plus optimized sequencing may produce a faster payback than buying additional compressor capacity.
Filtration and Separation Equipment
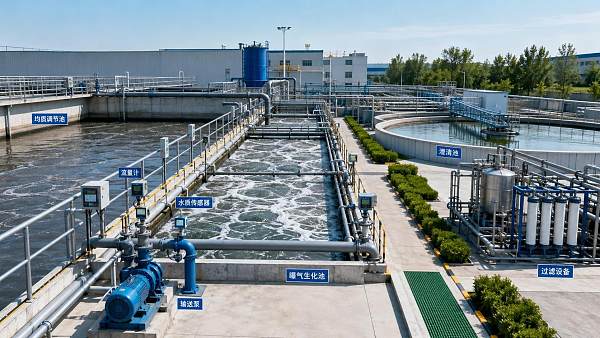
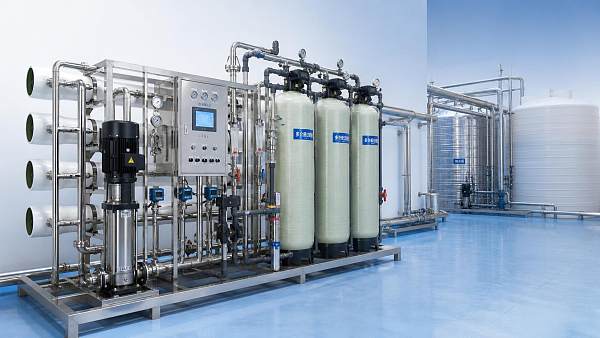
Filtration projects should be evaluated through throughput stability, consumables, water recovery, cleaning cycle frequency, and waste handling cost. In wastewater and process reuse applications, poor fouling control can increase membrane replacement frequency from 3–5 years to under 2 years. That significantly changes the total cost picture.
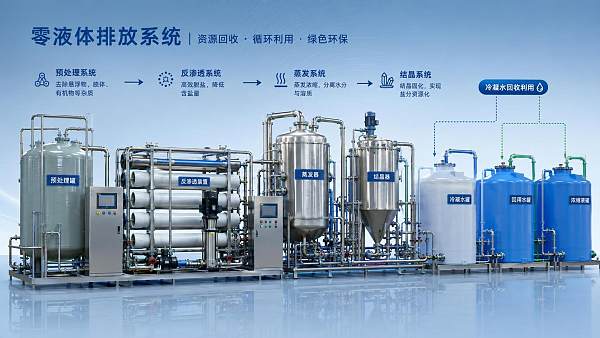
Where Zero Liquid Discharge or high-purity recovery targets apply, finance teams should request scenario costing for normal operation, upset operation, and cleaning downtime. A design that looks efficient on paper may become expensive if pretreatment is undersized.
The following comparison helps budget reviewers identify which cost levers matter most by equipment type.
For finance reviews, this comparison supports better line-by-line approval logic. It shows that each technology has one or two dominant lifecycle variables, and those variables should anchor commercial negotiations and supplier evaluation.
How Finance Approvers Can Evaluate ROI Without Oversimplifying
A common mistake in industrial automation solutions cost analysis is relying on a single payback number. For fluid and gas systems, a stronger model uses at least four financial dimensions: capital cost, annual operating savings, maintenance burden, and downtime risk reduction. In some cases, compliance resilience and water reuse value should be added as a fifth dimension.
A 5-step approval framework
- Define the critical process variable: flow, pressure, purity, or air availability.
- Separate must-have scope from optimization scope.
- Model annual savings using low, base, and high operating scenarios.
- Assign downtime cost per hour and estimated failure frequency.
- Review spare parts, service response time, and integration complexity before sign-off.
Useful thresholds for approval
Many finance teams use 18–36 months as a practical payback screen for efficiency upgrades. However, critical process assets may justify longer periods if they reduce outage exposure or support regulatory compliance. A valve network upgrade with only 10% energy benefit may still be approved if it reduces unstable batch quality or frequent operator intervention.
Likewise, serviceability should be quantified. If a supplier can shorten spare lead time from 16 weeks to 4 weeks, or reduce commissioning from 10 days to 4 days through skid prefabrication, that difference has real financial value even when the quotation is not the lowest.
Common budgeting blind spots
- Ignoring utility quality, such as dirty instrument air or unstable inlet water conditions
- Assuming nameplate efficiency equals real operating efficiency
- Underestimating engineering time for DCS, PLC, or historian integration
- Failing to budget startup consumables, calibration, and operator training
- Comparing quotations without matching scope, metallurgy, or acceptance criteria
For FCSM-focused sectors, this matters because fluid machinery economics are highly condition-dependent. Cavitation behavior, thermodynamic conversion efficiency, valve noise at critical velocity, and filtration fouling rates are not abstract engineering topics. They are cost drivers that shape maintenance intervals, production stability, and power bills throughout the asset lifecycle.
2026 Procurement Recommendations for Smarter Cost Control
The best 2026 procurement strategy is not always to spend less. It is to spend more selectively. For finance approvers, a high-quality industrial automation solutions cost analysis should favor systems that improve efficiency, simplify service, and provide diagnostic transparency. This is especially relevant where carbon reduction goals, water reuse targets, or labor constraints are increasing the value of predictable operations.
What to request from suppliers
- A duty-point-based energy estimate rather than a nameplate-only claim
- A bill of materials showing critical wetted parts, sensors, and control devices
- Recommended maintenance intervals in running hours and months
- Commissioning scope, shutdown assumptions, and operator training plan
- Spare parts strategy for 12, 24, and 36 months
Where digital monitoring pays off fastest
Digital layers typically create the fastest return in three areas: compressor demand management, pump condition monitoring, and smart valve diagnostics. In many plants, these upgrades require modest capex yet quickly expose leakage, off-design operation, actuator wear, or pressure instability. That makes them attractive for phased approvals when a full equipment replacement is not yet justified.
A phased roadmap can also reduce risk. Stage 1 may cover monitoring and controls in 6–8 weeks, Stage 2 mechanical replacement in the next planned shutdown, and Stage 3 optimization after 90 days of operating data. This structure is often easier for finance teams to approve because benefits can be validated before the largest capital step.
Final decision lens for finance leaders
When comparing proposals, finance leaders should ask three direct questions. First, which option reduces the cost of instability? Second, which option gives the clearest service and spare strategy over 3 years? Third, which option keeps the site flexible under tighter energy and environmental rules? These questions usually reveal more value than a simple comparison of purchase prices.
For organizations evaluating pumps, control valves, compressor systems, or filtration assets, the right approval model connects engineering detail with financial discipline. That is exactly where structured market intelligence and application-specific cost insight become useful.
A rigorous industrial automation solutions cost analysis in 2026 should measure more than equipment cost. It should connect capex to energy profile, maintenance intervals, uptime protection, and compliance readiness across fluid handling and process control assets. For finance approvers, that means better forecasting, fewer approval surprises, and stronger long-term asset decisions.
If you are assessing pump sets, smart valves, compressor packages, or separation systems for upcoming upgrades, FCSM can help you compare cost structures, technical trade-offs, and lifecycle risk with greater clarity. Contact us to get a tailored solution review, discuss product details, or explore more industrial fluid automation strategies for 2026.
Related News
 What drives industrial wastewater treatment cost per cubic meter?Dr. Alistair VaughnIndustrial wastewater treatment cost per cubic meter depends on influent load, effluent targets, energy, technology, and sludge disposal. Explore the key cost drivers.
 How to verify CE compliance for fluid separation equipmentDr. Alistair VaughnFluid separation equipment CE verification made practical: learn how to check declarations, risk assessments, technical files, pressure safety, and installation readiness.
 Separation equipment trends reshaping industrial wastewater treatmentDr. Alistair VaughnSeparation equipment trends are reshaping industrial wastewater treatment through smarter membranes, modular systems, digital monitoring, and resource recovery strategies.
 When stainless steel separation equipment is the right choice for hygienic processesDr. Alistair VaughnStainless steel separation equipment: discover when hygienic design, corrosion resistance, CIP cleanability, and lifecycle reliability make it the smart choice.
 What to assess before choosing a process industry automation supplierDr. Alistair VaughnChoose a process industry automation supplier with confidence. Assess engineering depth, lifecycle reliability, digital integration, energy performance, and safety before you buy.
 How process control innovation in refineries reduces unplanned shutdownsDr. Alistair VaughnDiscover how process control innovation in refineries detects early deviations, improves valve and equipment reliability, and helps prevent costly unplanned shutdowns.
 What should a zero liquid discharge systems integrator include in its proposal?Dr. Alistair VaughnZero liquid discharge systems integrator proposal checklist: compare guarantees, utilities, scope, controls, waste handling, and lifecycle risk before award.
 Industrial wastewater treatment plant design: sizing for flow and loadDr. Alistair VaughnIndustrial wastewater treatment plant design guide: size systems for peak flow, pollutant loads, reliability, compliance, and lower lifecycle costs.
 Can predictive maintenance and machinery diagnostics prevent downtime?Dr. Alistair VaughnPredictive maintenance machinery diagnostics help reduce unplanned downtime by detecting early equipment issues, improving reliability, and enabling smarter maintenance decisions.
 Can a digital transformation machinery platform cut unplanned downtime?Dr. Alistair VaughnDiscover how a digital transformation machinery platform connects asset data, maintenance workflows, and process insights to reduce unplanned downtime.
 How water treatment equipment sizing affects operating costsDr. Alistair VaughnWater treatment equipment sizing shapes energy, chemical, and maintenance costs. Learn how to balance flow, pressure, recovery, and reliability for efficient operation.
 When does food processing automation justify the upfront investment?Dr. Alistair VaughnIndustrial automation solutions for food processing: discover when automation delivers measurable ROI through higher throughput, lower waste, reliable utilities, and stronger food safety control.